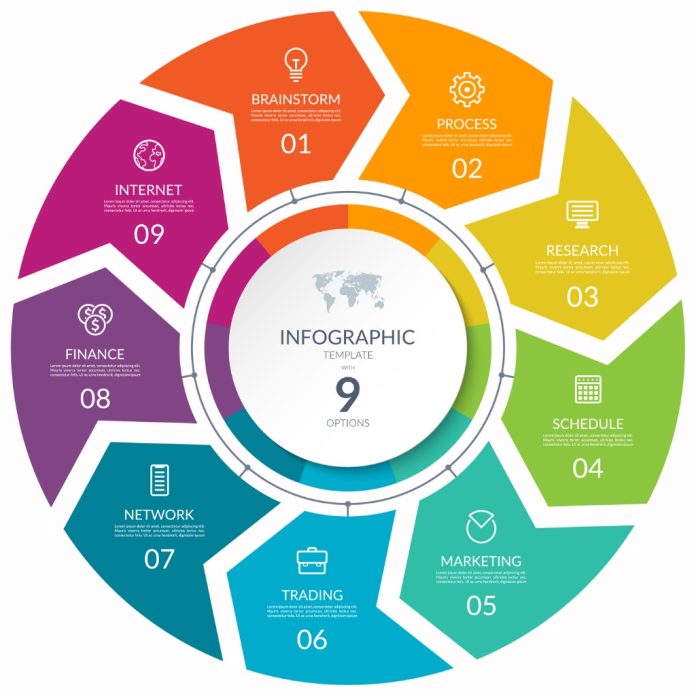
Infographics, also called Infogrames, have become indispensable in companies’ content marketing strategies. In this article, I will review what an infographic is, examples of infographics, the benefits of using this format, and the steps involved in creating a successful infographic.
What is an infographic
Infographics is a graphic representation that includes maps, tables, graphs, and diagrams, allowing complex concepts to be communicated simply.
Examples and benefits of infographics for companies
Through the following infographic example created by Irene Barrueco, the benefits of infographics for companies are shown:
- Presentation of results: it helps to understand better the data presented thanks to the graphic support and the schematization.
- Resource for website or blog: an excellent way to illustrate a corporate website or blog information. reading becomes more fun and easy
- Increase visibility on social networks: infographics create greater engagement (interaction) on social networks, increasing the message’s visibility in the online environment.
- They humanize the more friendly and familiar content as it is easily understandable.
- They reinforce the brand: creative infographics accompanied by the company logo will be more easily remembered thanks to the visual appeal.
- They help memory: we tend to remember what we see better than what we read.
If you want to see other examples of infographics, you can visit my Pinterest account, which has more than 2,000 Digital Marketing and Social Media infographics.
The steps to create an infographic are:
1. Choose the theme of the infographic
The first step in making an infographic is to choose the infographic’s topic. Some general examples of topics to make infographics are:
- The explanation of a concept
- The explanation of a technology
- Statistical data
- Summary of a document
It is ideal that the idea is popular on the Internet and especially on social networks, as this will facilitate the virality of the infographic when it is finished. Monitoring your target audience’s Twitter and Facebook accounts will help you identify trending topics on social media.
2. Identify the sources of information for the infographic
- A data collection process must be carried out on the topic to be addressed. It is essential to record the sources of information since they are a critical element in the infographic.
- Some sources of information to consider are Google, blogs, YouTube, Slideshare, Twitter, Wikipedia, electronic newspapers, specialized sites, etc.
- Within the sources of information, online or offline surveys carried out by us may also be included.
- An essential aspect of this step is to validate that the information collected is accurate since there are unreliable sources of information. The .gov and .edu sites are often excellent sources of information.
3. Organize ideas
- Organizing the collected information by grouping it by theme and sub-themes is essential. For this, a concept map program can be helpful.
- Aspects that are not very relevant or uninteresting should be discarded. This will prevent us from drowning in the sea of information collected in the previous point.
4. Create the infographic in gray (outline)
- Once the information collected has been organized, you should begin to outline the infographic. There is a pretty good free program for this activity: Mockflow.com.
- It is possible that during this stage, we do not realize the need to discard more information that we consider not essential to convey the idea we want to capture in the infographic.
- This stage is fundamental since it will be the one that gives creativity and clarity to the infographic.
5. Design the infographic
The design must take into account:
- Original style: Avoid copying graphic concepts from other infographics.
- Integration: An infographic should be graphically rich, avoiding designing it with a lot of text.
- Color: Colors with good contrast should be used to facilitate reading. An excellent tool that makes it easy to select colors is color.adobe.com.
- Fonts: An infographic should have creative use of fonts and letter sizes. The Dafont.com site contains various fonts that can be used as a guide.
- Icons: An infographic must contain simple images (icons) to communicate appropriately. The Freepik.es site has excellent material.
6. Use tools to create infographics
Top free tools for creating infographic elements:
- Canva is a web tool that allows people who are not designers to design and create images for the Internet; it has free templates to build infographics quickly.
- FlexClip: video creation platform with more than 1 million users has a completely free version.
- Adobe Spark: You can design infographics with Adobe Spark from templates on featured topics.
- Visme: It is a tool with many templates for infographics (many of them free), ideal for those of us who are not designers.
- Venngage: Tool in Spanish that allows people who are not designers to create attractive and compelling infographics. It has a free option that allows you to make up to 5 infographics.
- PiktoChart is a web tool that allows you to create attractive infographics from templates and objects that are added with a simple drag and drop. It allows you to customize colors and fonts in just one click, being very easy to use. The free option is a bit limited but allows for simple infographics.
- Easel.ly is a web tool that allows you to create sophisticated infographics from the templates they offer. It can drag and drop all kinds of symbols within them (lines, shapes, text, images, icons, etc.) to customize the final result without losing clarity or quality. Infographics can be exported in pdf, jpg, png, or web formats to be shared online.
- Nubedewords.es is a tool that allows you to create different shapes with the words you choose.
- Renderforest: an online tool with various editable and customizable templates to create video infographics and animatedly display data.


